
With capital in abundance, SaaS startups don’t seem to be too worried about how much runway they have remaining.
According to OpenView’s annual Financial & Operating Benchmarks report, only 13% of nearly 600 companies surveyed named “burning too much cash” as one of their top three concerns, compared to 30% last year.
While 2020 was atypical and a rebound this year is not surprising, the report goes one step further, arguing that there is an increasing gap between the haves and have nots of B2B software.
Nowhere is this more apparent, the authors claim, than when you look at public B2B SaaS companies. In an analysis accompanying the new report, they point out data showing that some companies see their enterprise value increase much faster than the competition.
The combination of an enormous market, a compelling growth engine and outstanding unit economics is helping top startups attract talent and capital, which might increasingly be escaping lower-performing companies, according to the report’s authors.
“Investors have forgotten all about the Rule of 40.” OpenView Partners
But what does that mean for founders that aren’t anywhere near an IPO yet? And which benchmarks can they use to evaluate their performance? To find out, we talked to the report’s two lead co-authors, OpenView’s Vice President Sean Fanning and Operating Partner Kyle Poyar. We also reached out to Dale Chang, operating partner at Scale Venture Partners, which aggregates data of its own via its Scale Studio; and to Matt Cohen from Canadian VC firm Ripple Ventures.
Our conversations covered some of the strategies SaaS companies can adopt to emulate their top peers — including product-led growth and usage-based pricing, of which OpenView is a known advocate — as well as a lingering concern: Are the multiples we are seeing sustainable?
Measuring up
If we had to only retain one chart from OpenView’s report, it would be the benchmarks table below, which features a few metrics and separates them based on the respondents’ annual recurring revenue (ARR):
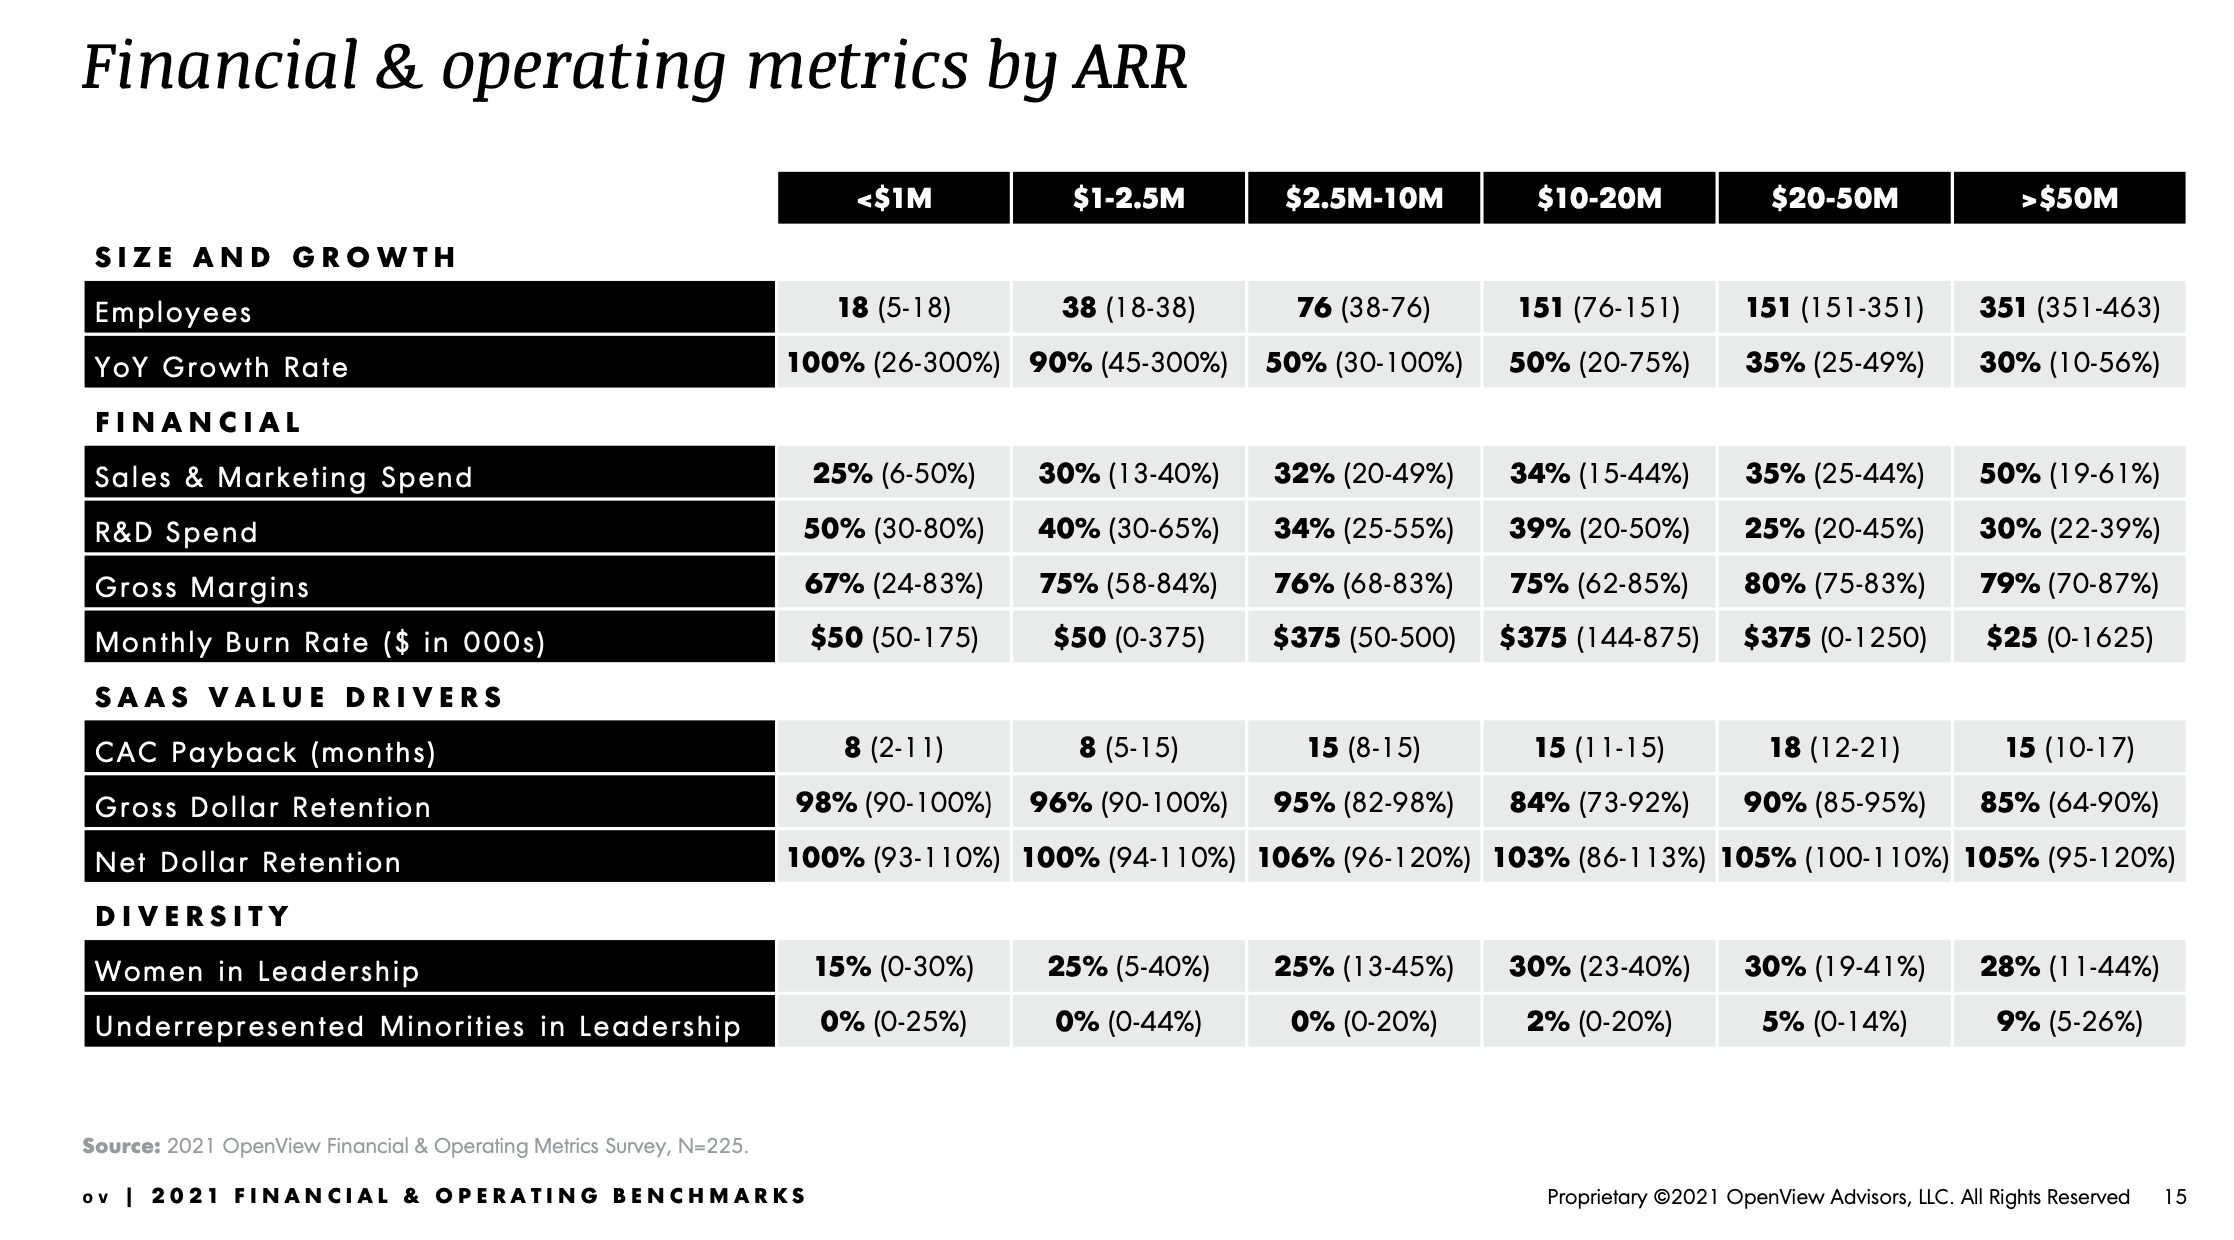
Image Credits: OpenView Partners
A note to readers explains that “each cell represents the median performance of a company, as well as the range (bottom quartile and top quartile) of each metric at each respective ARR scale” with the median in bold and the range in parentheses.
The authors note that “benchmarks are the map, not the territory” and that “performance and valuation are a multivariate equation.” Still, the founder of a startup with ARR between $1 million and $2.5 million might be pleased to see that growing 100% year on year means outperforming the average SaaS company in that category. But they will also note that top-of-class companies grow by about a whopping 300%.
All eyes on growth
The median growth rate of SaaS businesses would already leave the average SMB in dismay, but the top quartile’s performance is on a different level, especially for early-stage companies. Just look at this chart:
Powered by WPeMatico